Our diet has a major impact on the environment. But which foods have the largest, which the smallest carbon footprint? In search of answers, I came to Eaternity, a Swiss organization that specializes in calculating environmental footprints. In cooperation with Greenpeace Switzerland, they are now publishing a CO2 food poster that should make climate-friendly nutrition child’s play.
When I stand in front of well-stocked shelves in the supermarket, I often wonder about the journey they have taken. Maybe we look for the Max Havelaar seal of quality on the banana and the meat should come from Switzerland. But where does the feed for Swiss cattle actually come from? And where do the foodstuffs in the endlessly long lists of ingredients in the finished products come from?
As someone who wants to live as environmentally consciously as possible, these questions play an important role for me. How is the whole sustainable planet thing supposed to work if we’re completely in the dark here. CO2 emissions are produced throughout the entire journey that a food product goes through in production. Who tells me how much?
1/3 of all greenhouse gases
You may wonder why it is so important to know these CO2 emissions. In short, from a global perspective, the CO2 emissions caused by the food industry are enormous: the production of food causes one third of all greenhouse gases worldwide. That’s more than are generated by the entire transportation sector, i.e. cars, airplanes and ships combined. On a national level, the balance does not look any better. In Switzerland, food accounts for 21 percent of the climate impact of the demand side. It is therefore clear that everyone who eats can also make an active contribution to the climate! To do this, of course, we first need to know which foods are climate-friendly and which should be avoided.
The calculation of climate killers Behind the CO2 balances is a scientific discipline: life cycle analysis. Eaternity also calculates the balances by doing a quantitative analysis of the impact over the entire life cycle of the product, from farm to fork. Basically, a product goes through six phases: Agricultural production, transportation and distribution, further processing, use (consumption), and disposal of the product’s packaging and any leftovers. In our diet, most CO2 emissions occur in the agricultural phase.
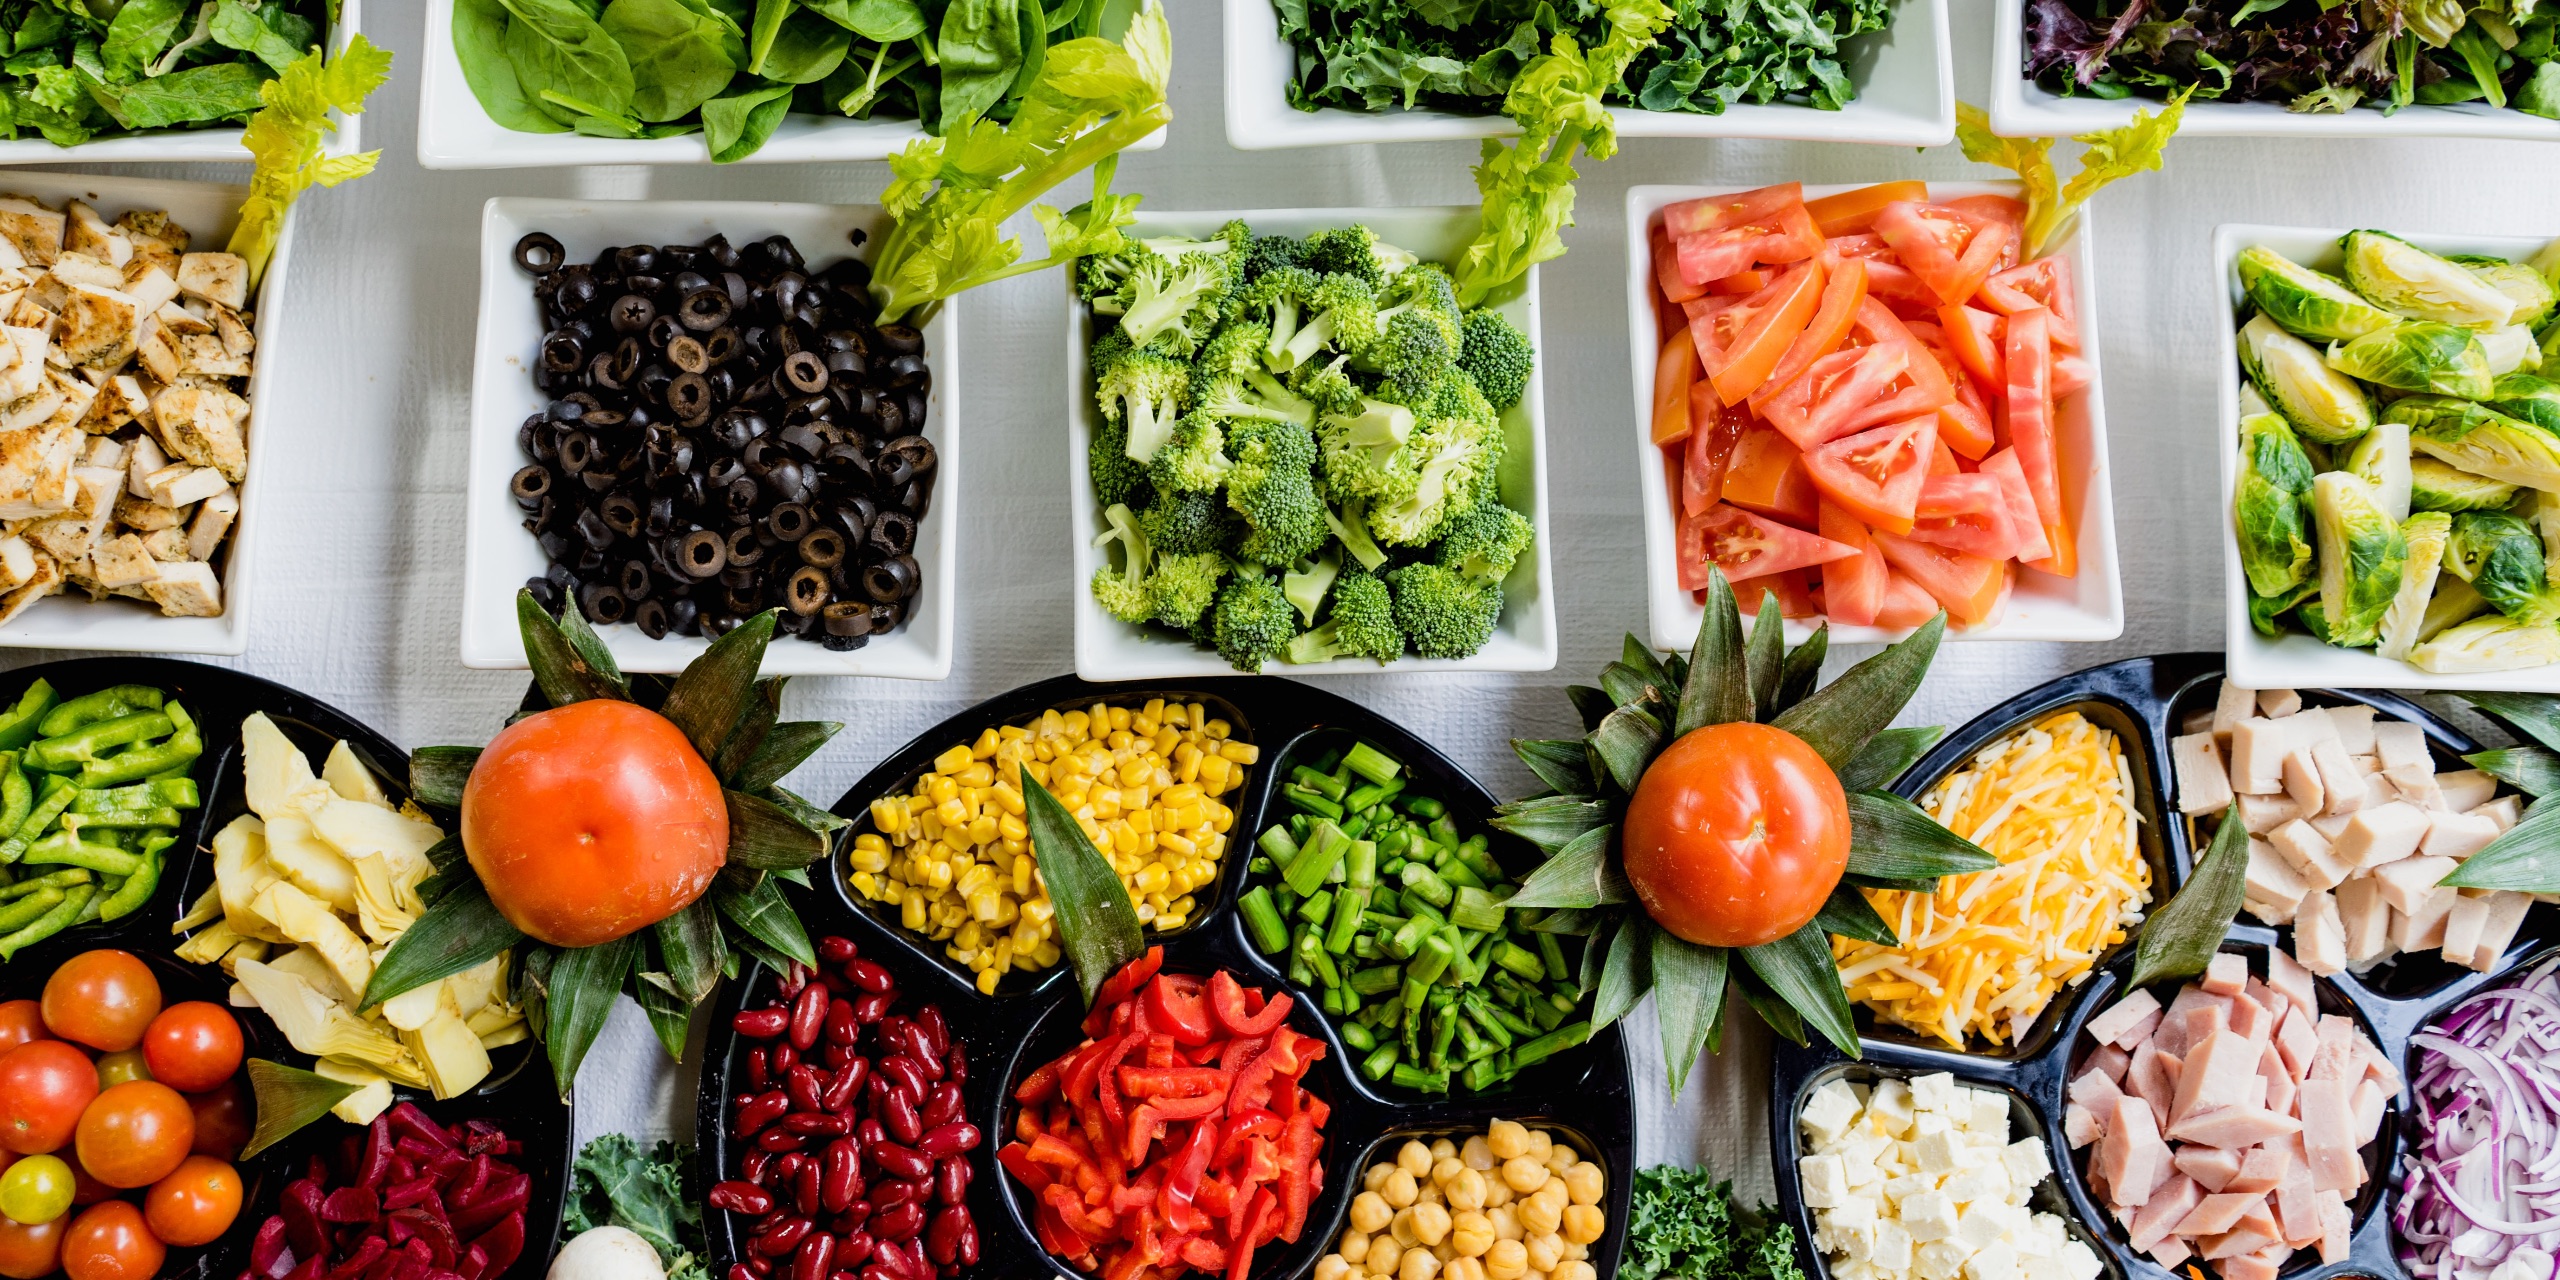
Through these analyses, Eaternity can confirm what every climate-conscious person probably knows by now: meat is climate polluter number 1. The results of the calculations are not encouraging: the production of 200 g of veal cutlet causes 11,120 g of CO2eq. In comparison, the production of 200 g of seitan (meat substitute products made from wheat protein) emits only 218 g of CO2eq. In general, plant-based foods perform much better than animal-based foods. What is the reason for this?
The simplest explanation: By omitting the detour through the animal stomach in the production of plant-based foods, large energy savings can already be made. For example, “keeping” plants consumes far less energy than keeping a family of cows. There are emissions from the electricity, gasoline and grazing land required. The animals’ respiration, digestion, and manure produce other greenhouse gases. Feed is often imported from abroad and further emissions are produced during transportation. Greenhouse gases are also released during the production of the feed due to the evaporation of the fertilizers in the field. When calculating the life cycle analyses, it becomes apparent that the largest emissions occur during
- the production of the feedstuffs,
- the conversion of land areas (forest clearing),
- the methane and salmon gases produced during digestion in the animal stomach, are produced. Other animal products such as milk, yogurt and butter are also found to have high CO2eq emissions.
Our oceans are CO2 sinks
When it comes to fish, the numbers don’t look any more promising: The production of 200 g of tuna generates 854 g of CO2eq. A recently published study shows that industrial fishing causes greater CO2eq emissions than all global air traffic. The environmental impact of bottom trawling, which involves dragging a fishing net across the ocean floor, was calculated. The researchers showed that by destroying these ocean beds, which are considered very effective CO2 sinks, the stored CO2 is released back into the water, and that this type of fishing also affects the ocean’s ability to absorb atmospheric carbon. This mitigates one of our best tools in the fight against climate change. All told, over a gigaton of CO2 is released as a result. By comparison, one gigaton is 1/50th of our complete global CO2 emissions. The target for eight billion people is eight gigatons (that’s one ton per person per year).
Butternut as front runner
You can enjoy virtually any unprocessed plant-based food without a guilty conscience. Butternut squash is a real front-runner with just 28 g CO2eq per 200 g. The life cycle of a vegetable begins in the field, continues through harvesting and processing, and ends with transport and packaging. The greatest emissions are caused by the conversion of land and by processes on the farm. In the case of vegetable products, it is also important to ensure that the food is not imported by air and that it is purchased in season if possible. Transport by air can increase the CO2 balance many times over, while transport by ship is very efficient and land transport usually accounts for a small proportion of the balance. Often it is better to import a food product than to produce it in a domestic greenhouse, as long as it comes from an environmentally friendly or even organic production. Even with plant-based convenience foods, which with a few exceptions all have an above average CO2 score, you can follow these rules.
All you can eat
Fortunately, I don’t have to remember the CO2 score of every food the way some people remember the calorie count. There’s an easier solution. On the CO2 poster of the project partners around the “All You Can Eat for Climate” campaign, the most common staple foods are clearly divided into four categories based on their CO2 footprint. If we consume the foods in the green range, we have a footprint that is 50 percent better than the average and can meet the climate targets of 2050. In the yellow range, we eat better, and in the orange range, we eat worse than average. Food in the red zone is 200 percent worse than an average diet. The difference between the balances in the green and red ranges are exponentially larger and become disproportionately worse for the climate along the scale.
The next time I’m in the supermarket, I’m now informed about which foods can end up in my shopping basket without a guilty conscience, and I’m also actively protecting the climate. This knowledge is very valuable, because the biggest lever for reducing CO2 emissions from our diet lies in our eating habits. These habits ultimately determine what food is produced by agriculture and from this follows again what climate impact agriculture has.
Do you want to eat in a climate-friendly way? The “All you can eat” poster illustrates the CO2 score of 500 foods and fits perfectly on your refrigerator.